
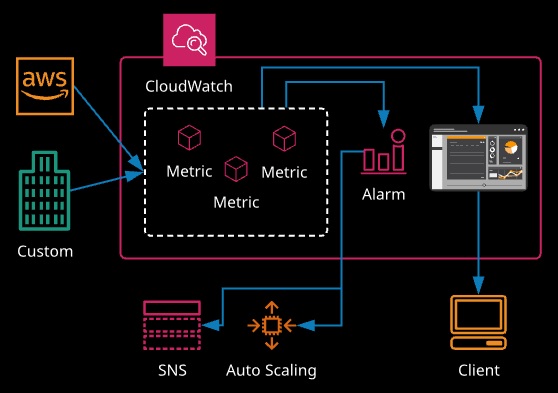
CloudWatch is a service that provides near real-time monitoring of AWS products. In essence, it’s a metrics repository. You can import custom metric data in real-time from some AWS services and on-premises platforms.
Data retention is based on granularity:
- One-minute metrics for 15 days
- Five-minute metrics for 63 days
- One-hour metrics are retained for 455 days
Metrics can be configured with alarms that can take actions, and data can be presented as a dashboard.
CloudWatch is:
- Real-time monitoring of your applications and resources on AWS
- Repository of metrics (AWS provided and custom)
- Metrics are data points related to resources and applications
- Examples:
- CPU utilization on EC2
- Number of connections to a database in RDS
- AWS services that provide free metrics:
- EC2, EBS, RDS
- Retention periods:
- 1-minute metrics are available for 15 days (detailed monitoring)
- 5-minute metrics are available for 63 days
- 1-hour metrics are available for 455 days
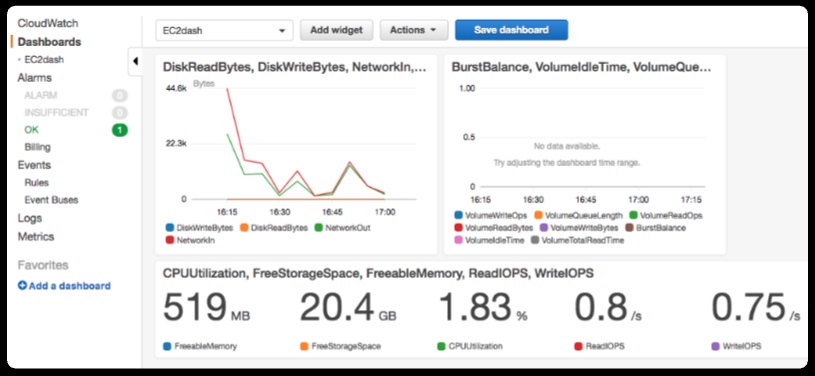
- Metrics can be graphed and compared
- For example: The CPU utilization for many instances can be layered on the graph together
- These graphs can then be configured as widgets and added to dashboards
- A user is fully able to customize a dashboard to show the metrics they want to monitor
- A user can also configure multiple dashboards
CloudWatch Alarms
What Else Can We Do with Metric Data?
- Watches a single metric over a specified time period and, based on the value of that metric relative to a threshold over time, performs one or more specified actions
- Three states of alarm:
- OK: The threshold is in the normal range
- ALARM: The threshold has been exceeded
- INSUFFICIENT: There is not enough data to evaluate the state
The main components of an alarm configuration:
- Metric: The data we are measuring
- Thresholds: The point at which we want some type of notification
- Period: The defined amount of time before notification
- Action: Has two parts:
- Change the state
- Send a notification
Services that can receive CloudWatch alarm notifications:
- Simple Notification Service (SNS)
- A topic gets triggered by CloudWatch
- Subscribers to that topic are notified (HTML, email, SQS, application, Lambda, SMS)
- Auto Scaling
- CloudWatch alarms trigger the scale up/down scenarios
- EC2
- CloudWatch alarms trigger EC2 actions like:
- Recover, stop, terminate, or reboot
- “Per-instance” metric is required
- CloudWatch alarms trigger EC2 actions like:
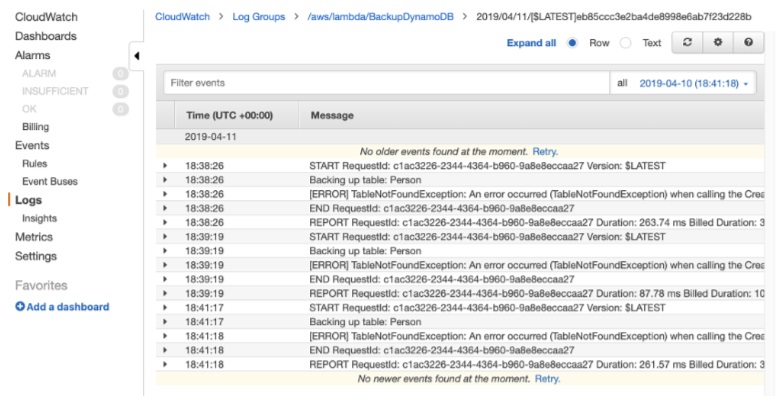
CloudWatch Logs provides functionality to store, monitor, and access logs from EC2, on-premises servers, Lambda, CloudTrail, Route 53, VPC Flow Logs, custom applications, and much more. Metric filters can be used to analyze logs and create metrics (e.g., failed SSH logins).
CloudWatch Logs to monitor, store, and access your log files from:
- EC2: Applications can be configured to send logs
- Exceptions, rate of errors, etc.
- Requires the install of CloudWatch Logs agent
- On-Premises Servers: With agent installed
- CloudTrail: Get logs from API activity in your account
- Route 53: Log information from DNS queries
Components
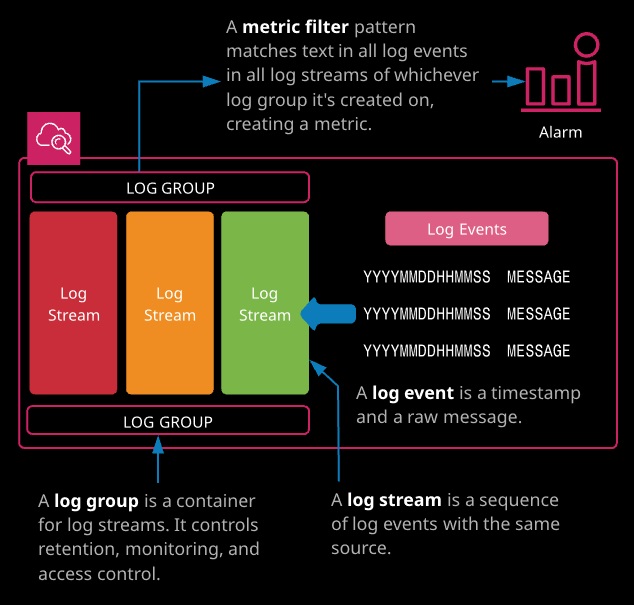
- Log Events: Record of activity recorded by the monitored resource
- Log Streams: Sequence of log events from the same source/application
- Log Groups: A collection of log streams with same access control, monitoring, and retention settings
- Metric Filters: Assigned to log groups, it extracts data from the groups’ log streams and converts that data into a metric data point
- Retention Settings: Period of time logs are kept. Assigned to log groups, but applies to all the streams in a group.
CloudWatch Logs Insights lets you interactively query and analyze your CloudWatch Logs data.
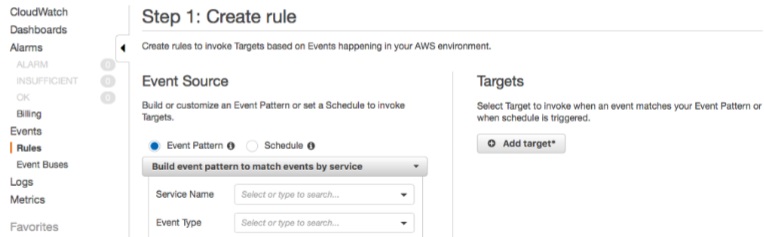
CloudWatch Events
CloudWatch Events has a near real-time visibility of changes that happen within an AWS account. Using rules, you can match against certain events within an account and deliver those events to a number of supported targets.
Within rules, many AWS services are natively supported as event sources and deliver the events directly. For others, CloudWatch allows event pattern matching against CloudTrail events. Additional rules support scheduled events as sources, allowing a cron-style function for periodically passing events to targets.
Some examples of event targets include:
- EC2 instances
- Lambda functions
- Step Functions state machines
- SNS topics
- SQS queues
- CloudWatch Events are similar to alarms. Instead of configuring thresholds and alarming on metrics, CloudWatch Events are matching event patterns and use targets to react.
- Near real-time
- Consists of three parts:
- Event Source: An operational change in a service or can be scheduled
- Rules: Route matching events to targets
- Targets: The services that will react to the event
- There can be more than one
- Some of the services that can be targets:
- EC2, Lambda functions, ECS tasks
- Kinesis Data Streams and Firehose
- Systems Manager Run Command and Automation
- CodeBuild project, CodePipeline
- SNS and SQS
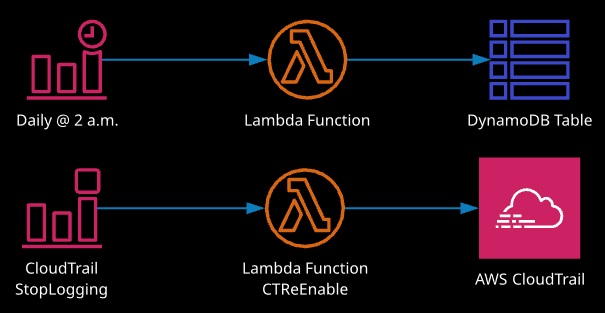
- Examples:
- Sharing an EBS snapshot triggers an SNS topic and a Lambda function
- Scheduling an EBS snapshot